Pandoc-plot
Because doodl is based on Pandoc, other tools in the Pandoc ecosystem are also available, in particular Laurent P. René de Cotret's Pandoc-Plot package. Pandoc-Plot allows you to insert, among other things, Python scripts that use matplotlib to insert visualizations right into our Markdown documents. It works like this.
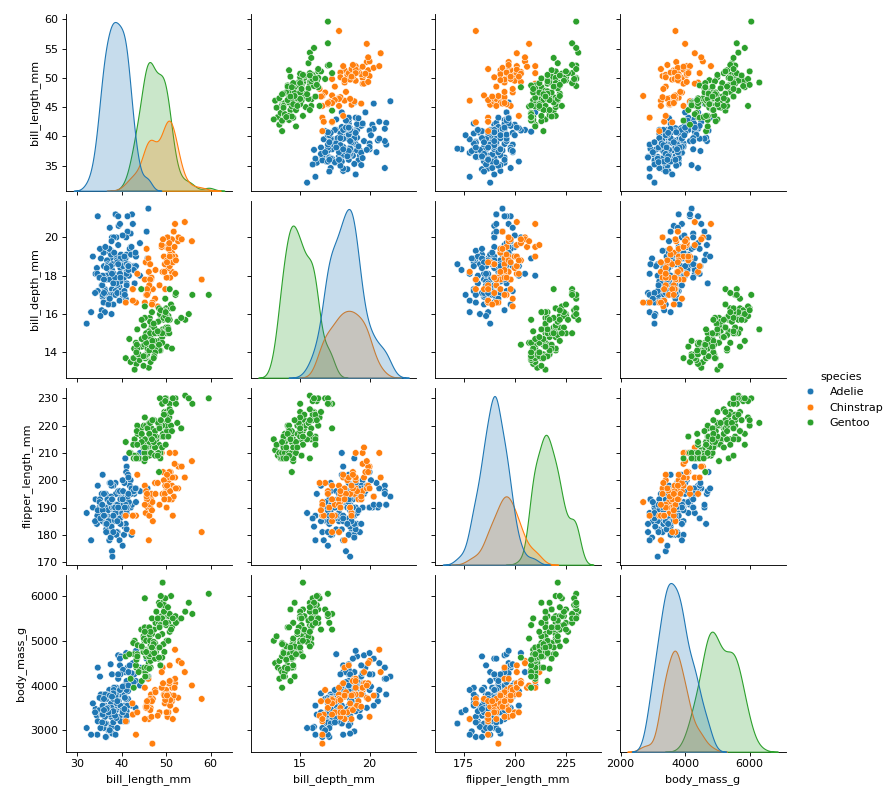
Once you've got a Python script that generates a (single) visualization that you like, you insert the script right into your document, offset as a code block, like this:
```{.matplotlib}
import seaborn as sns
df = sns.load_dataset("penguins")
sns.pairplot(df, hue="species")
```
To tell doodl to include the Pandoc-Plot when it calls pandoc, use the -p (or --plot) flag, like this:
% doodl --plot file.mdHere is the output:
Some things to note:
- The pandoc-plot Pandoc filter must be installed on your computer.
- Any data that you load must be loaded for each
matplotlibcode block. - The code block must produce a single plot object.
- You must not call
plot.show().
The output plots will be generated in PNG, and placed in a plots folder for you, in the same folder that holds the output file, if doodl is run in formatter mode.
Note that Pandoc-Plot has more tricks than matplotlib up its sleeve. Here's a list, from the README in Pandoc-Plot's Github repository:
plotly_python: plots using the plotly Python libraryplotly_r: plots using the plotly R librarymatlabplot: plots using MATLABmathplot: plots using Mathematicaoctaveplot: plots using GNU Octaveggplot2: plots using ggplot2gnuplot: plots using gnuplotgraphviz: graphs using Graphvizbokeh: plots using the Bokeh visualization libraryplotsjl: plots using the JuliaPlots.jlpackageplantuml: diagrams using the PlantUML software suitesageplot: plots using the Sage software systemd2: plots using D2asymptote: plots using Asymptote
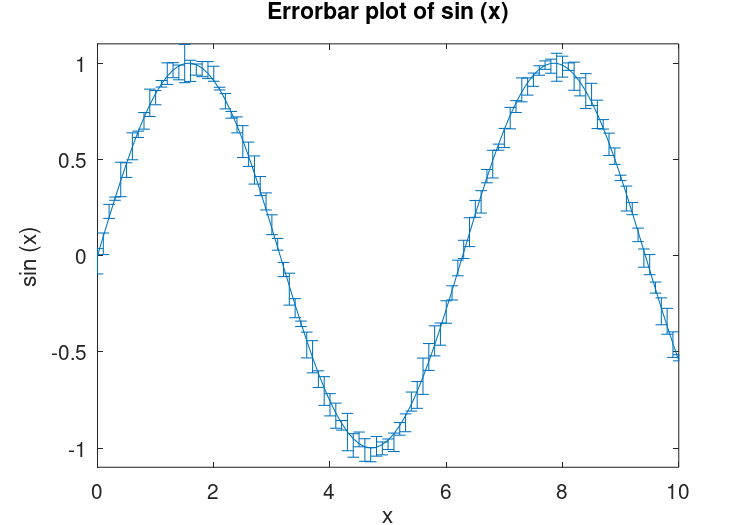
For example, this GNU Octave script:
~~~{,octaveplot}
rand ("state", 2);
x = 0:0.1:10;
y = sin (x);
lerr = 0.1 .* rand (size (x));
uerr = 0.1 .* rand (size (x));
errorbar (x, y, lerr, uerr);
axis ([0, 10, -1.1, 1.1]);
xlabel ("x");
ylabel ("sin (x)");
title ("Errorbar plot of sin (x)");
~~~
would produce this: